Observability
Dubbo maintains observability metrics across multiple dimensions and supports various methods of visual monitoring. Observability metrics can be broadly categorized into three measurement dimensions:
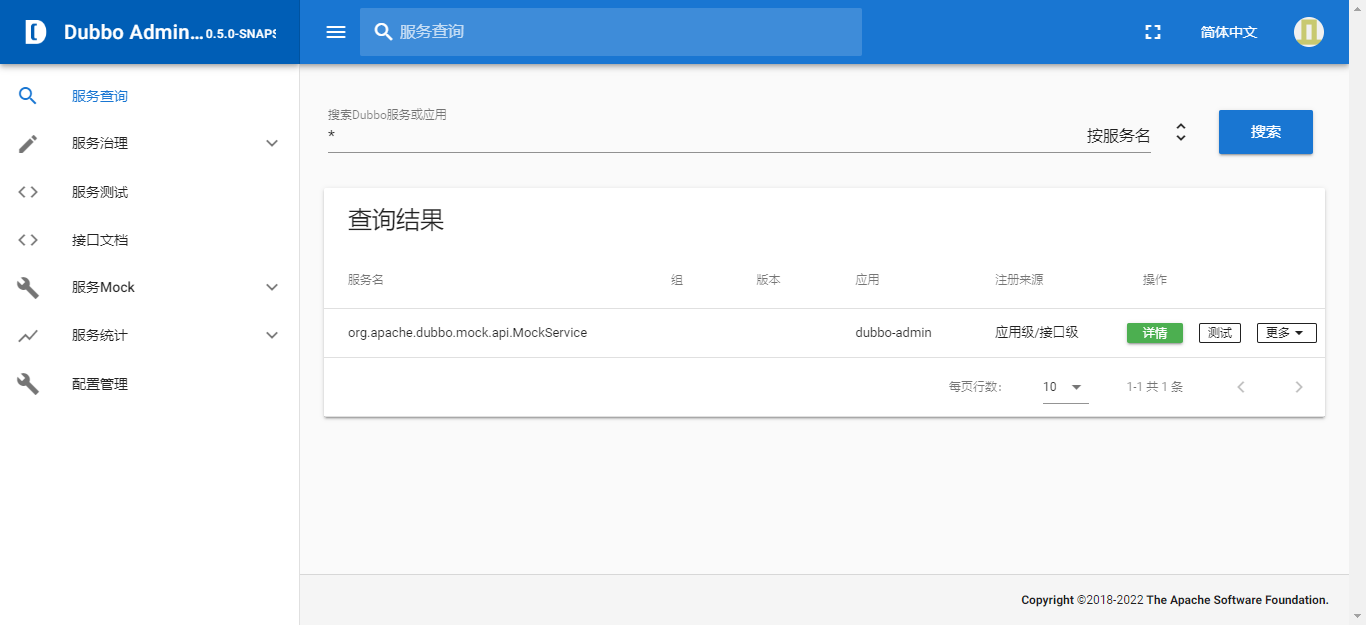
Admin. The Admin console provides a visual representation of applications, services, instances, and dependency relationships within the cluster. It supports the issuance of traffic governance rules. Additionally, it offers tools such as service testing, mocking, and document management to enhance the efficiency of development and testing processes.
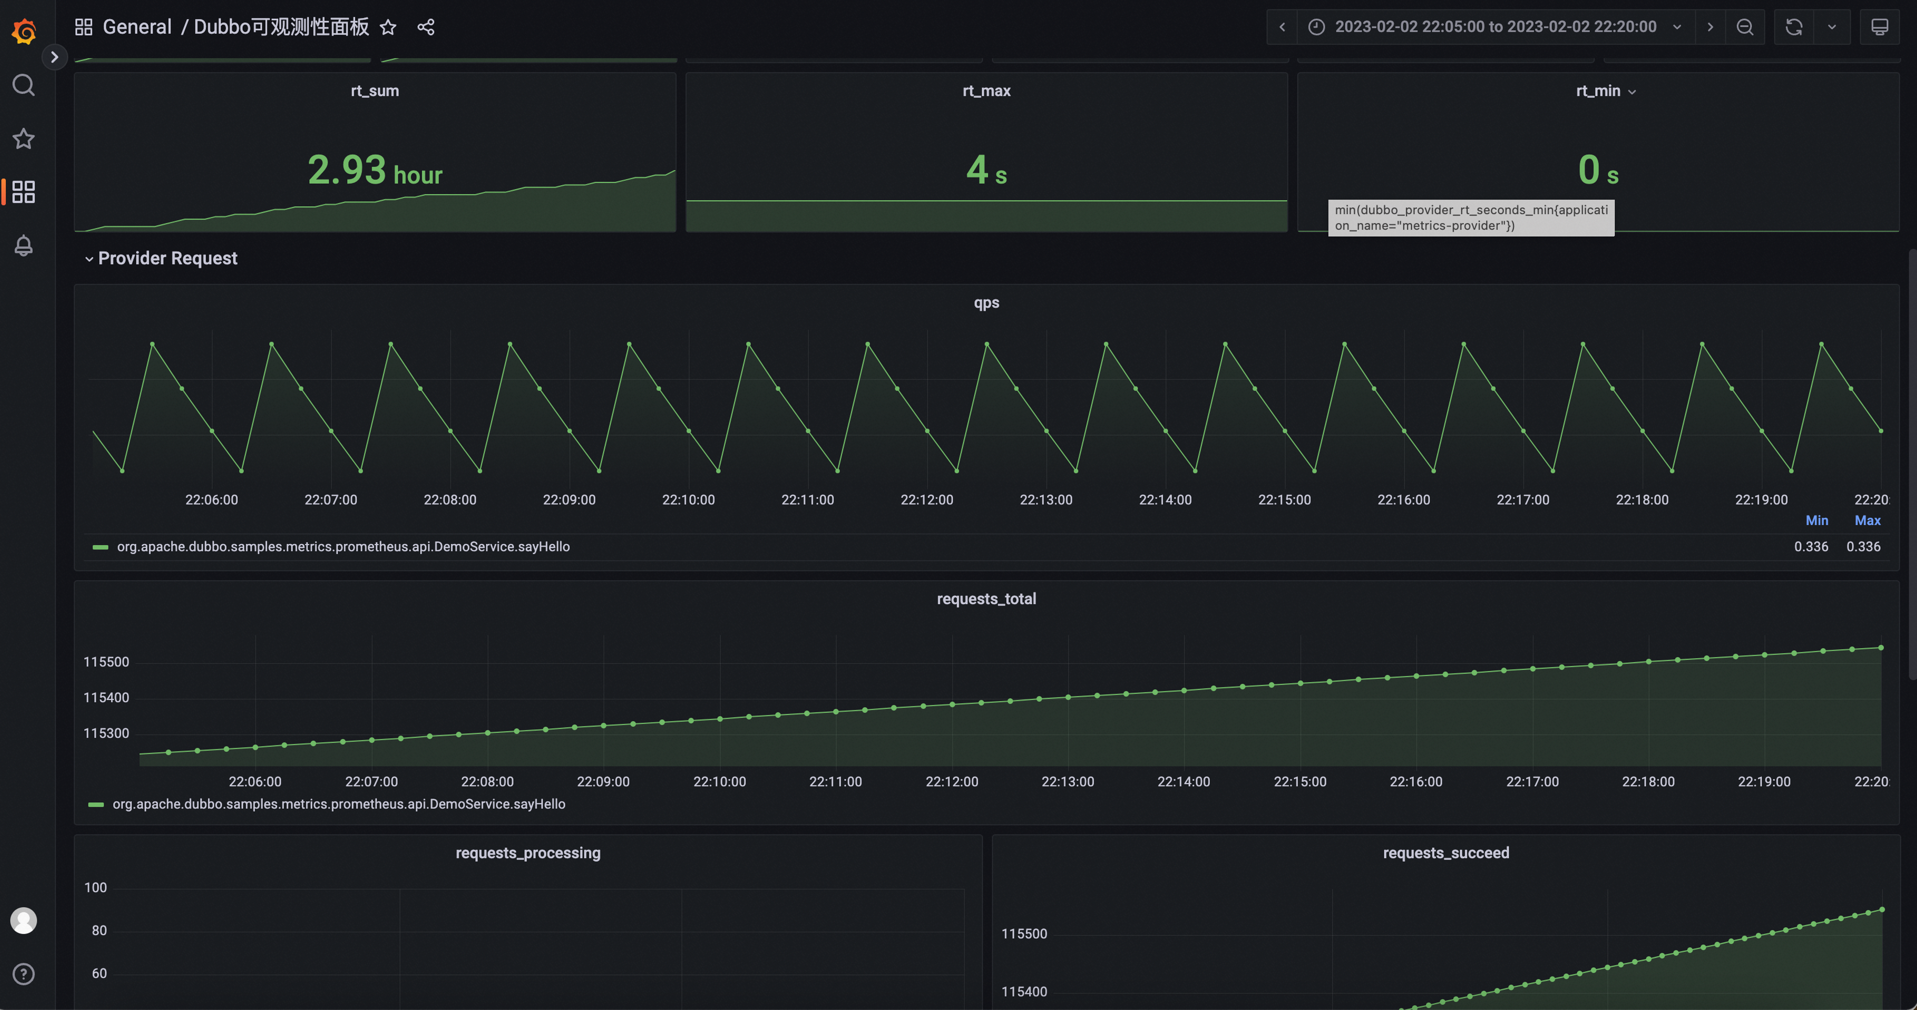
Metrics. Dubbo collects a range of traffic metrics such as QPS (Queries Per Second), RT (Response Time), successful requests, failed requests, and also includes various internal component statuses like thread pool count, service health status, and more.
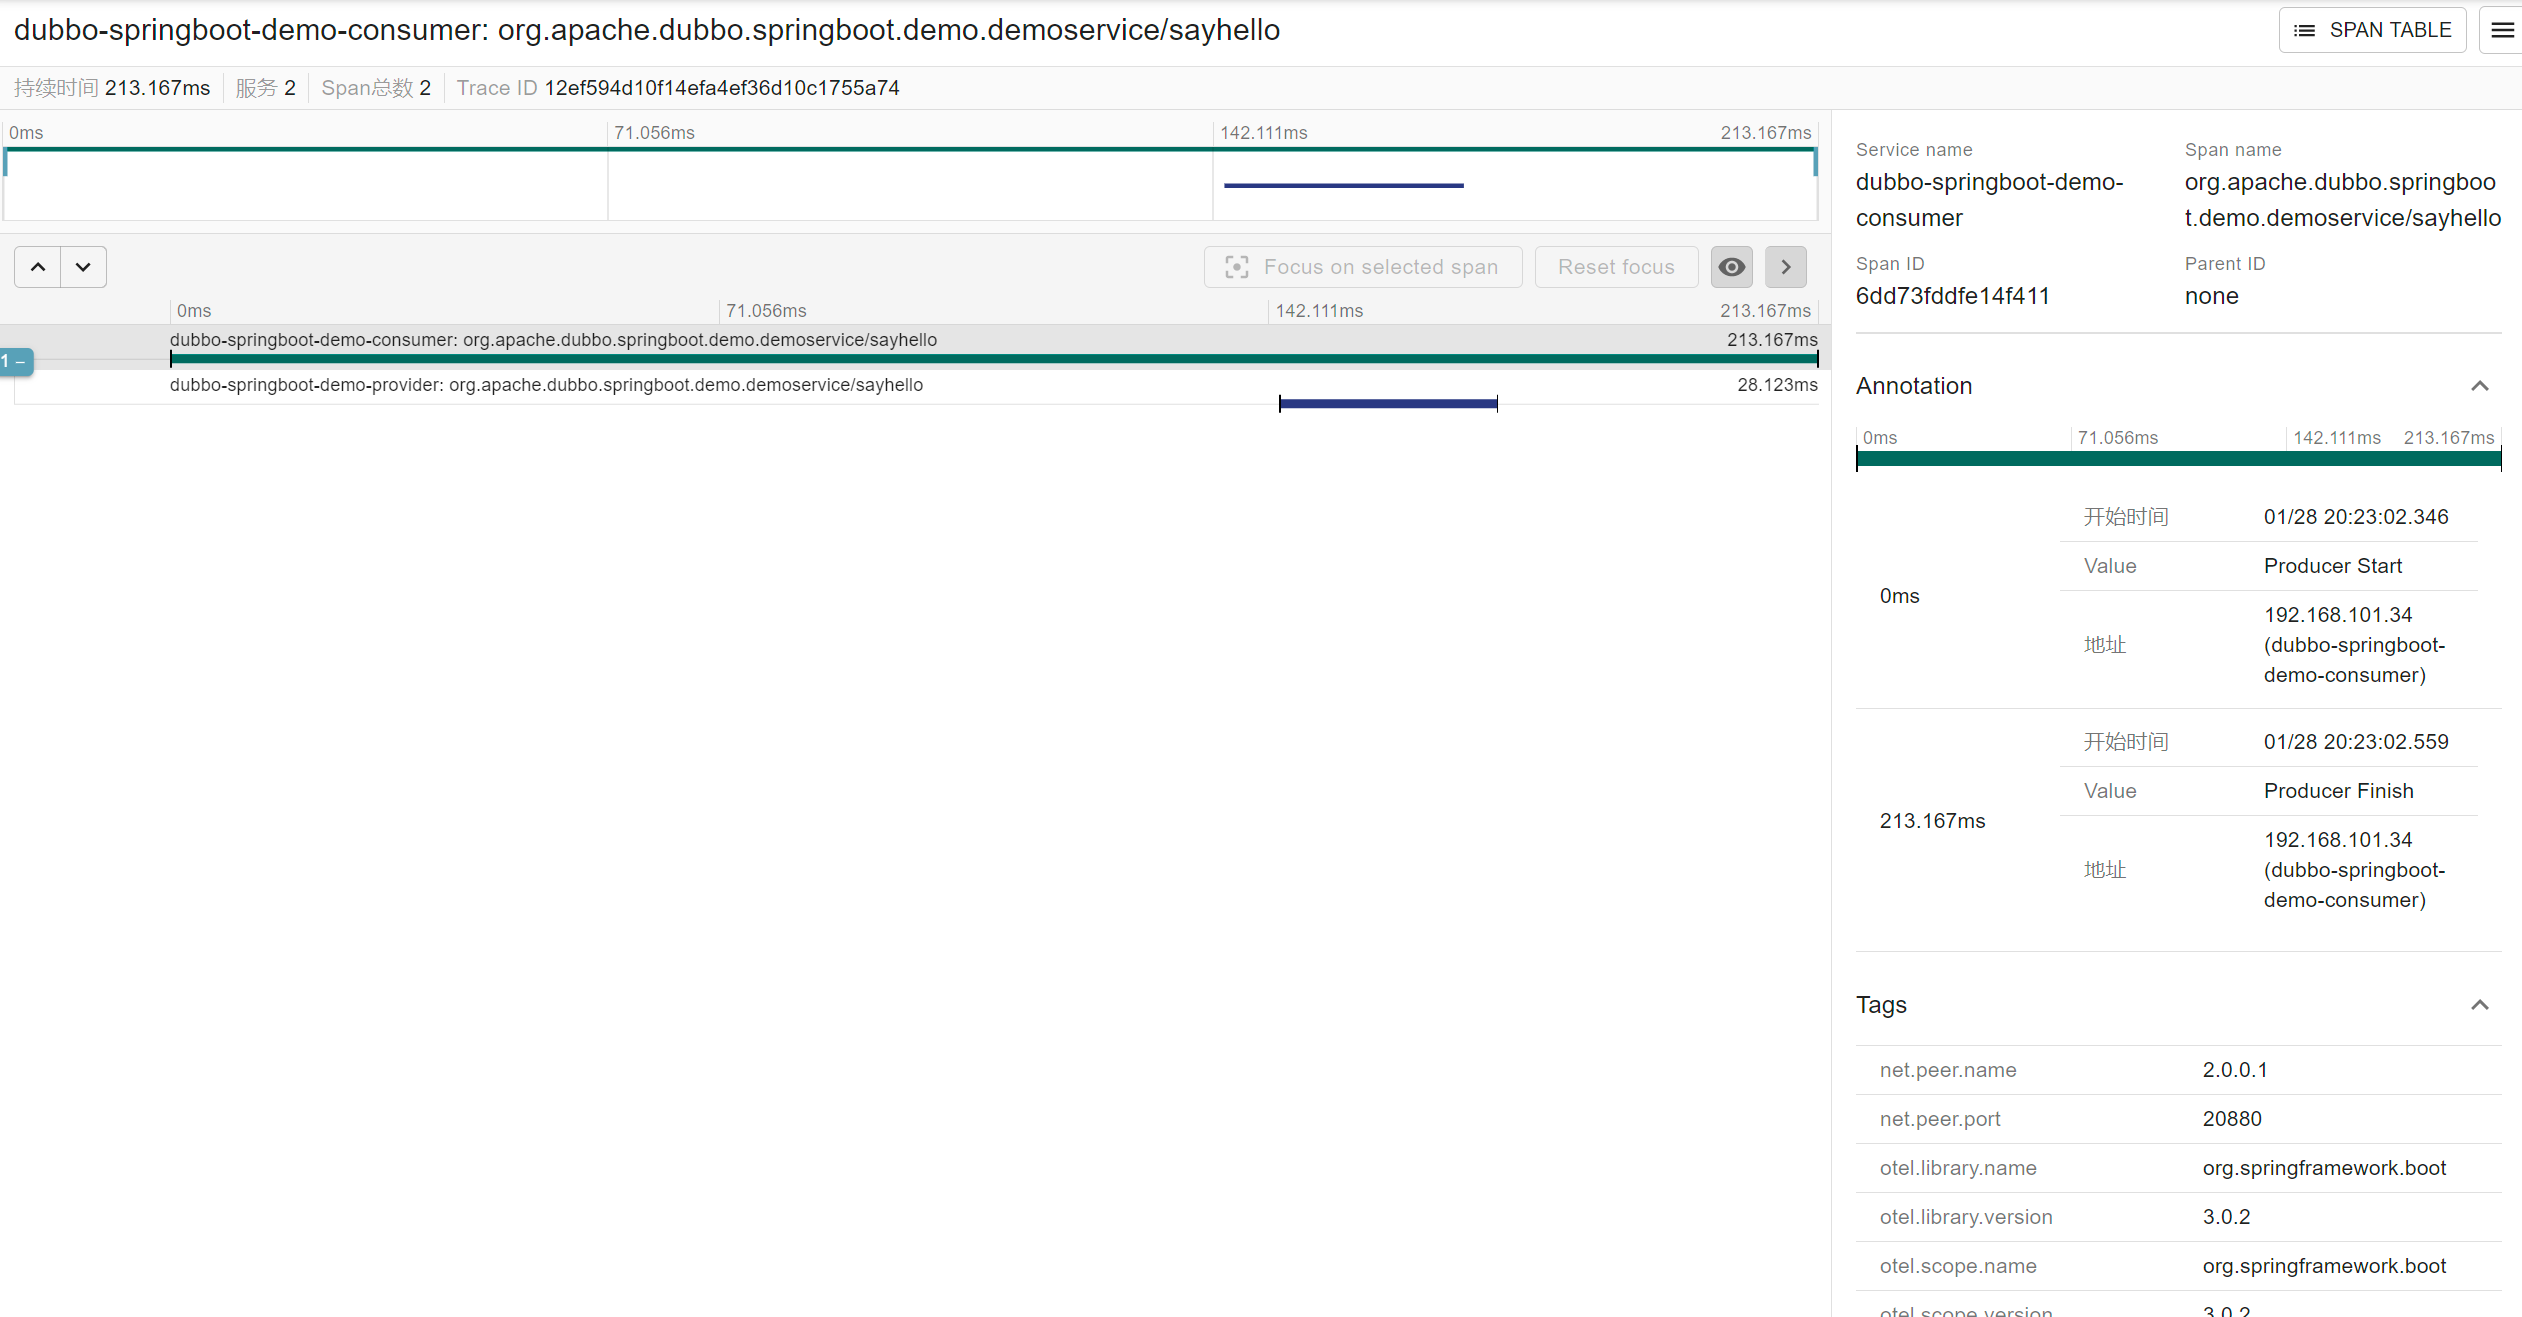
Tracing. Dubbo has been adapted to work with mainstream industry-level distributed tracing tools, including Skywalking, Zipkin, and Jaeger. These tools all support the tracing of Dubbo services.
Logging. Dubbo supports adaptation to multiple logging frameworks. In the Java ecosystem, it provides support for various frameworks including Slf4j, Log4j2, Log4j, Logback, Jcl, etc. Users can choose the appropriate framework based on their business requirements. Additionally, Dubbo also supports Access Log to record request traces.
Admin
The Admin console provides a visual representation of applications, services, instances, and dependency relationships within the cluster. It supports the issuance of traffic governance rules. Additionally, it offers tools such as service testing, mocking, and document management to enhance the efficiency of development and testing processes.

Metrics
At runtime, Dubbo collects core service metrics, including QPS (Queries Per Second), RT (Response Time), total invocations, successful invocations, and failure statistics, along with reasons for failures. Additionally, for more effective monitoring of service operation, Dubbo offers monitoring of essential component states such as thread pool count and service health status.
You can visualize the metrics using Grafana.

Tracing
Full link tracing holds significant value in monitoring the operational status of distributed systems. Dubbo achieves runtime pointcut tracing through Filter interceptors. By exporting trace data to prominent platforms like Zipkin, Skywalking, Jaeger, etc., comprehensive end-to-end tracking data analysis and visual representation can be accomplished.

With just a simple line of configuration, you can switch the backend implementation for tracing. Moreover, you have the flexibility to dynamically adjust Dubbo’s tracing sampling rate through governance platforms like Dubbo Admin, which proves highly valuable for troubleshooting.
Logging
Access logs can assist in analyzing system traffic. In certain scenarios, enabling access logs can also be very helpful for troubleshooting issues.